Clouds & Radiation
The study of clouds, where they occur, and their characteristics, play a key role in the understanding of climate change. Low, thick clouds primarily reflect solar radiation and cool the surface of the Earth. High, thin clouds primarily transmit incoming solar radiation; at the same time, they trap some of the outgoing infrared radiation emitted by the Earth and radiate it back downward, thereby warming the surface of the Earth. Whether a given cloud will heat or cool the surface depends on several factors, including the cloud's altitude, its size, and the make-up of the particles that form the cloud. The balance between the cooling and warming actions of clouds is very close although, overall, averaging the effects of all the clouds around the globe, cooling predominates.
The Earth's climate system constantly adjusts in a way that tends toward maintaining a balance between the energy that reaches the Earth from the sun and the energy that goes from Earth back out to space. Scientists refer to this as Earth's "radiation budget." The components of the Earth system that are important to the radiation budget are the planet's surface, atmosphere, and clouds. The energy coming from the sun to the Earth's surface is called solar energy. Most of it is in the form of radiation from the "visible" wavelengths, i.e., those responsible for the light detected by our eyes. Visible radiation and radiation with shorter wavelengths, such as ultraviolet radiation are labeled "shortwave." Both the amount of energy and the wavelengths at which energy is emitted by any system are controlled by the average temperature of the system's radiating surfaces, plus the emission properties. The temperature of the sun's radiating surface, or photosphere, is more than 5500°C (9900°F). However, not all of the sun's energy comes to Earth. The sun's energy is emitted in all directions, with only a small fraction being in the direction of the Earth.
Energy goes back to space from the Earth system in two ways: reflection and emission. Part of the solar energy that comes to Earth is reflected back out to space in the same, short wavelengths in which it came to Earth. The fraction of solar energy that is reflected back to space is called the albedo. Different parts of the Earth have different albedos. For example, ocean surfaces and rain forests have low albedos, which means that they reflect only a small portion of the sun's energy. Deserts, ice, and clouds, however, have high albedos; they reflect a large portion of the sun's energy. Over the whole surface of the Earth, about 30 percent of incoming solar energy is reflected back to space. Because a cloud usually has a higher albedo than the surface beneath it, the cloud reflects more shortwave radiation back to space than the surface would in the absence of the cloud, thus leaving less solar energy available to heat the surface and atmosphere. Hence, this "cloud albedo forcing," taken by itself, tends to cause a cooling or "negative forcing" of the Earth's climate.
Another part of the energy going to space from the Earth is the electromagnetic radiation emitted by the Earth. The solar radiation absorbed by the Earth causes the planet to heat up until it is emitting as much energy back into space as it absorbs from the sun. Because the Earth is absorbing only a tiny fraction of the sun's energy, it remains cooler than the sun, and therefore emits much less radiation. Most of this emitted radiation is at longer wavelengths than solar radiation. Unlike solar radiation, which is mostly at wavelengths visible to the human eye, the Earth's longwave radiation is mostly at infrared wavelengths, which are invisible to the human eye. When a cloud absorbs longwave radiation emitted by the Earth's surface, the cloud reemits a portion of the energy to outer space and a portion back toward the surface. The intensity of the emission from a cloud varies directly as its temperature and also depends upon several other factors, such as the cloud's thickness and the makeup of the particles that form the cloud. The top of the cloud is usually colder than the Earth's surface. Hence, if a cloud is introduced into a previously clear sky, the cold cloud top will reduce the longwave emission to space, and (disregarding the cloud albedo forcing for the moment) energy will be trapped beneath the cloud top. This trapped energy will increase the temperature of the Earth's surface and atmosphere until the longwave emission to space once again balances the incoming absorbed shortwave radiation. This process is called "cloud greenhouse forcing" and, taken by itself, tends to cause a heating or "positive forcing" of the Earth's climate. Usually, the higher a cloud is in the atmosphere, the colder is its upper surface and the greater is its cloud greenhouse forcing.
If the Earth had no atmosphere, a surface temperature far below freezing would produce enough emitted radiation to balance the absorbed solar energy. But the atmosphere warms the planet and makes Earth more livable. Clear air is largely transparent to incoming shortwave solar radiation and, hence, transmits it to the Earth's surface. However, a significant fraction of the longwave radiation emitted by the surface is absorbed by trace gases in the air. This heats the air and causes it to radiate energy both out to space and back toward the Earth's surface. The energy emitted back to the surface causes it to heat up more, which then results in greater emission from the surface. This heating effect of air on the surface, called the atmospheric greenhouse effect, is due mainly to water vapor in the air, but also is enhanced by carbon dioxide, methane, and other infrared-absorbing trace gases.
In addition to the warming effect of clear air, clouds in the atmosphere help to moderate the Earth's temperature. The balance of the opposing cloud albedo and cloud greenhouse forcings determines whether a certain cloud type will add to the air's natural warming of the Earth's surface or produce a cooling effect. As explained below, the high thin cirrus clouds tend to enhance the heating effect, and low thick stratocumulus clouds have the opposite effect, while deep convective clouds are neutral. The overall effect of all clouds together is that the Earth's surface is cooler than it would be if the atmosphere had no clouds.
Cloud-Radiative forcing
Low clouds tend to have a net cooling effect on global climate. Low level clouds are often thick and reflect much of the incoming shortwave radiation. In addition, because of their low altitude and resulting high temperature they emit large amounts of longwave radiation towards space and higher levels in the atmosphere. Conversely, high clouds tend to have a net warming effect as they because of their high altitude and resulting low temperature only emit little longwave radiation towards space. In addition, they are usually thin, and only reflect little of the incoming shortwave radiation.
1. High clouds
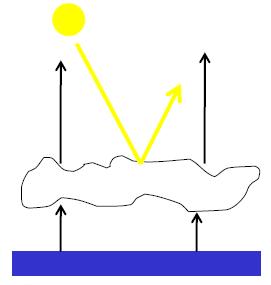
- Highly transparent to Short wave radiation
- Absorb the outgoing Long wave radiation
- Enhance atmospheric greenhouse warming
[High-level clouds strongly restrict emission out to space.]
2. Low clouds
- Lower clouds are much thicker. -> not transparent
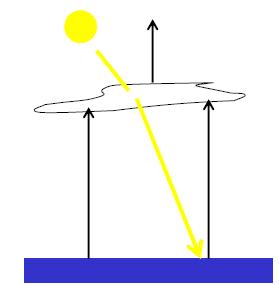
- Reflect much of the solar radiation to space
- Radiate LW radiation at nearly the same intensity as the surface -> does not affect outgoing IR energy much -> greenhouse forcing is small.
- Net effect of low clouds is to cool the surface.
[Low-level clouds strongly reflect sunlight back to space.]
Positive cloud feedbacks if these occur with global warming:
• decreased low-level cloud over
• decreased low-level cloud reflectivity
• increased high-level cloud cover
• increased height of high-level cloud cover
Negative cloud feedbacks if these occur with global warming:
• increased low-level cloud cover
• increased low-level cloud reflectivity
• decreased high-level cloud cover
• decreased height of high-level cloud cover
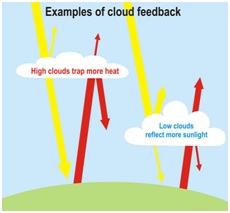
The effect of clouds in a warming world is a difficult one to predict. One challenge is that clouds have both warming and cooling effects. Low-level clouds in particular tend to cause a cooling effect by reflecting sunlight, while high-level clouds tend to cause a warming effect by trapping heat. So as the planet warms, clouds can have a cooling effect if the amount of low-level clouds increases and/or if the amount of high-level clouds decreases. Clouds will have a warming effect if the opposite is true. Thus it becomes complicated to figure out the overall effect of clouds, because scientists need to determine not only if the amount of clouds increases or decreases in a warming world, but which types of clouds are increasing or decreasing.
For climate scientists who are skeptical that anthropogenic greenhouse gas emission will cause a dangerous amount of warming, such as Richard Lindzen and Roy Spencer, their skepticism hinges mainly on this cloud cover uncertainty. They tend to believe that as the planet warms, low-level cloud cover will increase, thus increasing the overall reflectiveness of the Earth, offsetting the increased greenhouse effect and preventing a dangerous level of global warming from occurring. However, some recent scientific studies have contradicted this theory.
Most of the cloud feedback uncertainty is due to cloud changes near the equator, in the tropics and subtropics (Stowasser et al. 2006). Studies by Lauer et al. (2010) and Clement et al. (2009) both looked at cloud changes in these regions in the east Pacific, and both concluded that based on a combination of ship-based cloud observations, satellite observations, and climate models, the cloud feedback in this region appears to be positive, meaning more warming.
Dessler (2010) used cloud measurements over the entire planet by the Clouds and the Earth’s Radiant Energy System (CERES) satellite instruments from March 2000 to February 2010 to attempt to determine the cloud feedback. Dessler concluded that although a very small negative feedback (cooling) could not be ruled out, the overall short-term global cloud feedback is probably positive (warming), and may be strongly positive. His measurements showed that it is very unlikely that the cloud feedback will cause enough cooling to offset a significant amount of human-caused global warming.
So while clouds remain a significant uncertainty and more research is needed on this subject, the evidence is building that clouds will probably cause the planet to warm even further, and is very unlikely to offset a significant amount of human-caused global warming. It's also important to remember that there many other feedbacks besides clouds, and there is a large amount of evidence that the net feedback is positive and will amplify global warming.
Radiative forcing depending on the cloud types
Cloud-type variations are shown to be as important as cloud cover in modifying the radiation field of the earth–atmosphere system.
The largest “annual” mean changes of the global top-of-atmosphere and surface shortwave radiative fluxes are produced by stratocumulus, altostratus, and cirrostratus clouds (i.e., clouds with moderate optical thicknesses). Cirrus, cirrostratus, and deep convective clouds (i.e., the highest-level clouds) cause most of the annual mean changes in the global top-of-atmosphere longwave radiative fluxes; whereas the largest annual mean changes of the global surface longwave radiative fluxes are caused by stratocumulus, cumulus, and altostratus.
Globally, clouds cool the Earth-atmosphere system (Harrison et al., 1990).
Positive values are found over deep convective regions in the tropics, and over dry land areas where high, thin clouds occur (Hartmann and Doelling, 1991). Cloud radiative forcing relates to cloud itself and the region it covers.
Below figures show the seasonal change of the cloud radiative forcing at the TOA in Central Pacific and Sahara Desert. (Green line: observational value from ERBE. Black line: calculation with ISCCP C2 cloud parameters.) Filled color shows each cloud type's contribution to the total cloud forcing.
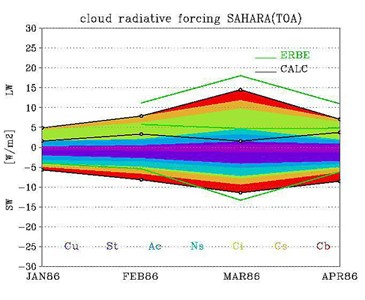
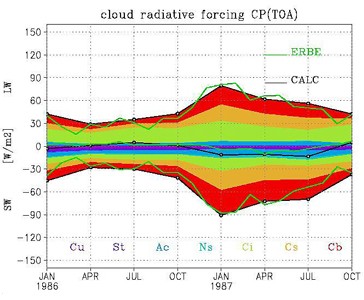
In Central Pacific, SW and LW cloud radiative forcing get larger during Elnino period. Although both SW and LW forcing are large, they almost cancel each other. High clouds originated from convection have large contributions to the forcing and seem to get thicker.
In Sahara, clouds are rare and its amount and radiative foricng have seasonal change. A peak appears in the early spring.
Cloud data
Since July 1983, ongoing variations in the global cloud cover have been monitored by The International Sattelite Cloud Climatology Project (ISCCP). This project was established as part of the World Climate Research Program (WCRP) to collect weather satellite radiance measurements and to analyse them to infer the global distribution of clouds, their properties, and their diurnal, seasonal and interannual variations. The resulting datasets and analysis products are being used to improve understanding and modelling of the role of clouds in climate, with the primary focus being the elucidation of the effects of clouds on the global radiation balance.
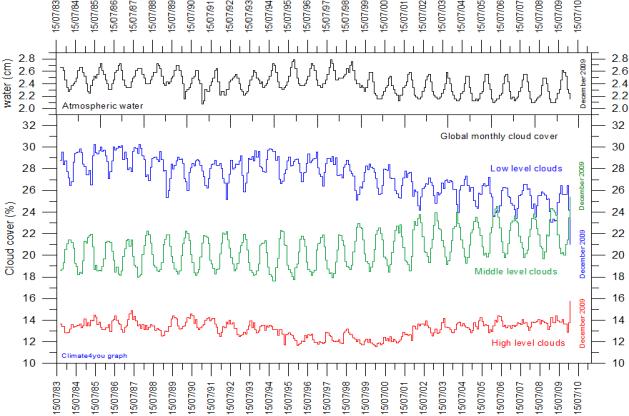
The above diagram is showing monthly variations in global cloud cover for high, middle and low clouds since July 1983. The uppermost panel shows the variation of the total amount of water vapour in the atmosphere. During the period of observations, the amount of low clouds (net cooling effect on global temperature) has been decreasing from about 29 percent in 1986 to about 25 percent in 2007. A secondary low and peak were recorded in 1990 and 1994, respectively. The amount of middle clouds (no clear net effect on global temperature) has been slowly increasing from about 20 percent in 1984 to about 22 percent in 2007. The amount of high clouds (net warming effect on global temperature) decreased slightly until around 1999, and has since then again increased somewhat. The time labels indicate day/month/year. Data source: The International Satellite Cloud Climatology Project (ISCCP). The ISCCP datasets are obtained from passive measurements of IR radiation reflected and emitted by the clouds. Please note that the step-like change in atmospheric water content 1998-1999 may be related to changes in the analysis procedure used for producing the data set, according to information from ISCCP. The cloud cover data, however, should not be affected by this. Last data: December 2009. Last figure update: 4 September 2011.
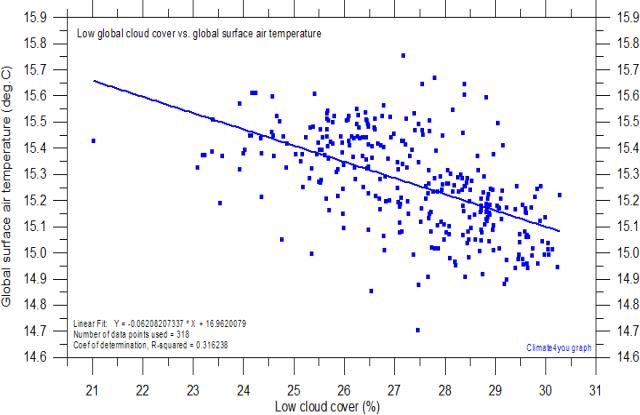
Scatter diagram showing the global monthly low cloud cover plotted versus the monthly global surface air temperature, since July 1983. High values of low cloud cover are associated with low global temperatures, demonstrating the cooling effect of low clouds. A simple linear fit model suggests that an increase in global low cloud cover of 1 percent corresponds to a global temperature decrease of about 0.06oC. From a simple statistical point of view, this model explains about 31 percent of observed spread of surface air temperature in the diagram. The cooling effect of low clouds is almost similar to the effect of all types of clouds shown higher up this page. The global surface air temperature was calculated by adding 15oC to HadCRUT3 temperature anomaly data. Nobody knows the real surface air temperature of planet Earth, but this presumably represents a useful approximation. The statistical association between cloud cover and global temperature shown does not depend upon this calculation. The global cloud data are of course dominated by the huge surface areas near the Equator, and on a smaller scale the regional and local effect could well deviate from the average global cooling effect displayed by this diagram. Data sources: The International Satellite Cloud Climatology Project and University of East Anglia's Climatic Research Unit. Last cloud data used: December 2009. Last figure update: 4 September 2011.
As mentioned above, it has been suggested that the special conditions during the period following the 1991 Mount Pinatubo eruption might affect the association between monthly low cloud cover and global temperature shown in the diagram above. However, removing the data from the period with low temperatures after the eruption (199107-199212) only has a very small effect on the statistics as can be seen from the text in the diagram. So the conclusion remains that an global increase in low cloud cover of 1 percent empirically is associated with a decrease in global surface air temperature of about 0.07oC.
Tropical cloud cover and global air temperature
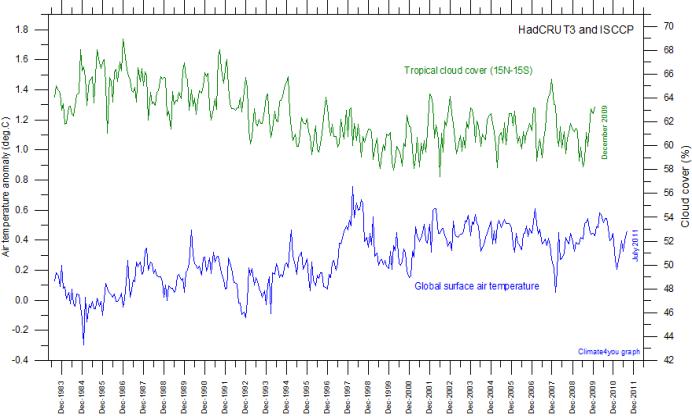
Tropical (15oN-15oS) total cloud cover (green) according to the International Satellite Cloud Climatology Project (ISCCP), and global monthly average surface air temperature (blue) according to Hadley CRUT, a cooperative effort between the Hadley Centre for Climate Prediction and Research and the University of East Anglia's Climatic Research Unit (CRU), UK. The ISCCP datasets are obtained from passive measurements of IR radiation reflected and emitted by the clouds. The diagram begins at July 1983, the starting date for the ISCCP cloud data series. Base period for the HadCRUT3 is 1961-1990. Last month shown for HadCRUT3 data: July 2011. Last month shown for ISCCP data: December 2009. Latest diagram update: 4 September 2011.
The amount of direct solar radiation received in the Equatorial regions presumably is important for both the global sea surface temperature and the global air temperature. In this context, the amount of tropical clouds is likely to represent an important control on the amount of direct solar radiation reaching the planet surface near Equator, from where the heat might be at least partly redistributed to more extensive parts of the planet surface by ocean currents and advecting air masses. The diagram above lends empirical support to this inference. The period until around year 2000 was characterised by generally increasing global air temperature and decreasing tropical total cloud cover. Following 2000, the stable or even slightly decreasing global surface air temperatures associates with a small increase in total tropical cloud cover. In the diagram below, the amount of high level and low level tropical cloud cover is shown for additional information. The amount of middle level clouds has essentially been stable since 1983; about 15-16 per cent, and is not shown in this diagram.
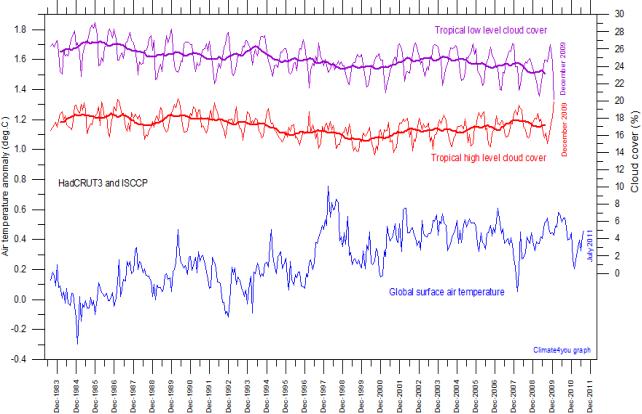
Tropical (15oN-15oS) high (red) and low (purple) cloud cover according to the International Satellite Cloud Climatology Project (ISCCP), and global monthly average surface air temperature (blue) according to Hadley CRUT, a cooperative effort between the Hadley Centre for Climate Prediction and Research and the University of East Anglia's Climatic Research Unit (CRU), UK. The ISCCP datasets are obtained from passive measurements of IR radiation reflected and emitted by the clouds. The two thick lines show the running 13 month average. The diagram begins at July 1983, the starting date for the ISCCP cloud data series. Base period for the HadCRUT3 is 1961-1990. Last month shown for HadCRUT3 data: July 2011. Last month shown for ISCCP data: December 2009. Latest diagram update: 4 September 2011.